The original wizard of Wall Street, W.D Gann was a finance trader and wealthy speculator that spent decades investigating cyclical trends in equity market patterns and found that prices could be predicted long in advance.
He successfully predicted the crashes in the 1929 and Dot-Com stock market bubbles.
And according to his analysis, the US stock market is due for another crash in 2020.
After suffering through the worst economic and financial crisis since the 1930s depression when the real estate and stock markets crashed in 2007, the United States’ bubble economy is back into full swing. Residential and commercial real estate prices are growing strongly, along with equities.
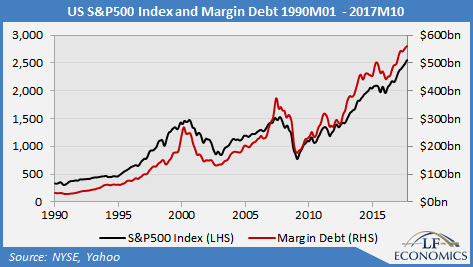
The US stock market, as defined by the S&P500 index, has boomed after collapsing to a trough in 2009. The market ‘recovered’ more quickly than anyone thought it would, and has continued surging from thereon in.
This has led to a lot of commentary and media coverage that the S&P500 is in the thrall of yet another bubble that will burst. Despite the many predictions of collapse, the bubble has powered on unhindered.
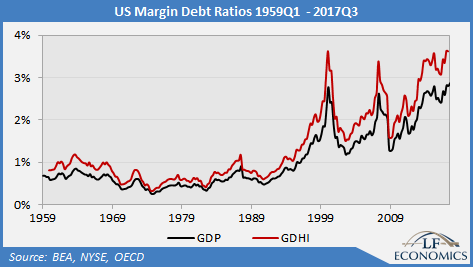
Like all asset bubbles, the primary cause is speculators taking on debt to bid up prices to ever-higher levels, generating a stream of greater fools willing to purchase at inflated valuations. In the case of equities, the type of debt used is margin debt.
The trends in the S&P500 index and margin debt are obvious. The name of the game is capital gains; income is increasingly sidelined as yields become compressed to record lows.
The annual change in margin debt (the first derivative) closely tracks that of the S&P500 index. In Australia, this was true of our largest equities bubble on record, which peaked in 2007 and then burst, declining by 55% from peak to trough.
Margin debt all too coincidently rose rapidly during the boom.
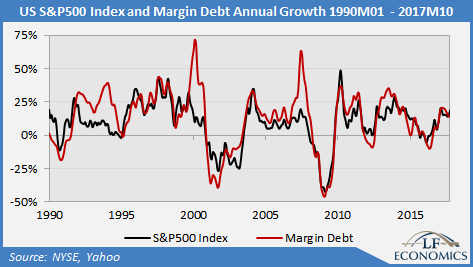
In the case of the S&P500 bubbles which peaked in 2000 and 2007, margin debt also peaked a few months beforehand in terms of absolute values, annual growth and acceleration (the second derivative).
It is therefore worth closely tracking the trends in margin debt to understand where equity prices are heading.
Another metric to watch out for is private non-financial business debt because the very low interest rates on business bank loans makes it easy for corporate executives to drive up stock prices by loading up on debt to engage in stock buybacks.
As prices are often linked to executive remuneration, they have every incentive to engage in this unproductive strategy.
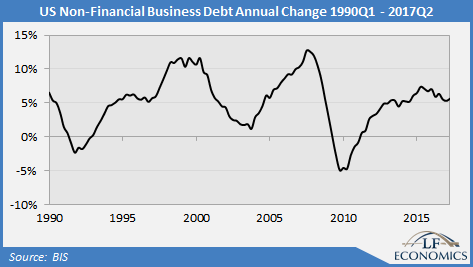
The peaks in the annual change of non-financial business debt correspond with those of the equities market. It should be noted that non-financial business debt is also used to speculate on commercial land, which is why land prices cycle in tandem with debt.
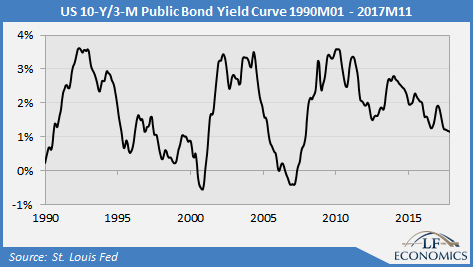
The yield curve is one of the best leading indicators of recession and equity market downturns. The yield curve inverted a few months before both peaks in 2000 and 2007. Currently, the yield curve is 108 basis points above zero, and could take a while before it inverts.
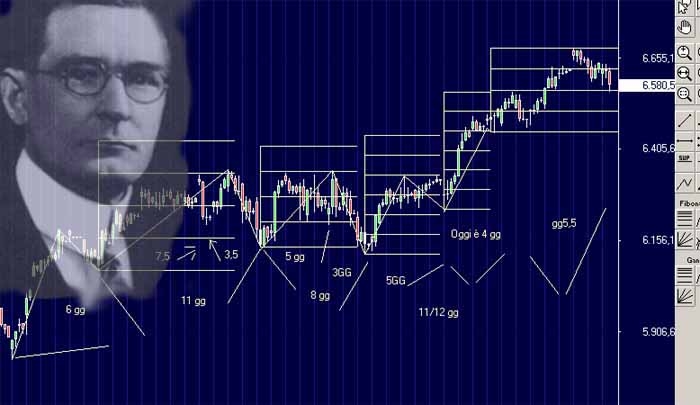
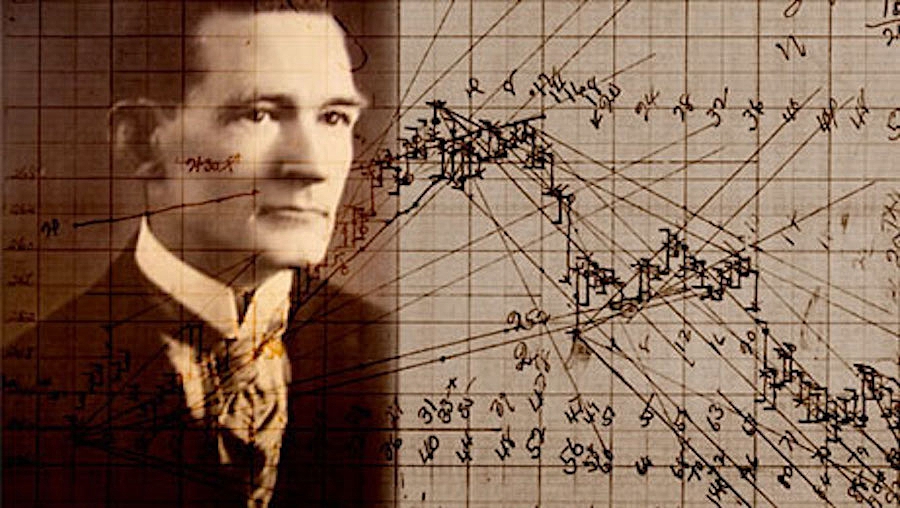
While the metrics noted above can accurately indicate the peak of an equities bubbles several months in advance, they cannot tell us anything years ahead of time. For this, we must turn to the research of the original wizard of Wall Street, W.D. Gann. He was a finance trader who developed technical analysis tools and forecasting methods based on geometry, astronomy, astrology and ancient mathematics.
He was a successful and wealthy speculator, spending decades investigating patterns in equities markets. He concluded that equities exhibited a cyclical trend over decades and thus prices could be predicted long in advance.
In 1908, Gann constructed his financial timetable, which tabulated the booms and busts, peaks and troughs of the US equities market. Just like the Geoist land market cycle, there is a repeating 18-year average between every major cycle.
Gann managed to predict the crash of 1929 years in advance. He realised that the timetable would have to be recalibrated on the 25th December 1989.
The updated timetable is amazingly accurate from that date onward, predicting the Dot-Com bubble peak in 2000 and its collapse. The GFC peak was off by one year; 2007 instead of one year earlier in 2006. The trough was in 2009, followed by a minor panic in 2015, when the S&P500 dipped but has since boomed.
According to the timetable, 2020 will be the peak of the equities bubble, followed by a major crash similar to that of the Dot-Com bubble.
To the economists we’ve spoken to, the peak could range between 2019M09 to 2020M03. Given how large the S&P500 bubble has become, it is worth treading very carefully during this period for those exposed to US equities.
Due to the ETF revolution, it is a straightforward matter to gain exposure to the S&P500, including leveraged and inverse instruments. It would be even better if the government would enact policies to prevent speculation and subsequent bubbles in the first place. This can be done by banning margin debt and other securities-based loans, and heavily taxing capital gains based on the length of time they were held for (the longer, the less tax).
While the equities market boom has added a great deal of wealth to the balance sheet of US households, it is merely the latest instance in a long line of asset bubbles. No doubt many speculators believe that ‘this time is different’ but the ghost of Gann would argue otherwise.
Disclaimer: Any written content (including charts, tables and other images) may not be interpreted as financial advice.

There's nothing like the idea of a unionised worker to make the predatory capitalist convulse.

Why is the ability to call a home your own becoming the privilege of the few as opposed to the right of the many?

What if the racism and inequality that America faces today are not accidental but actually happened by design?